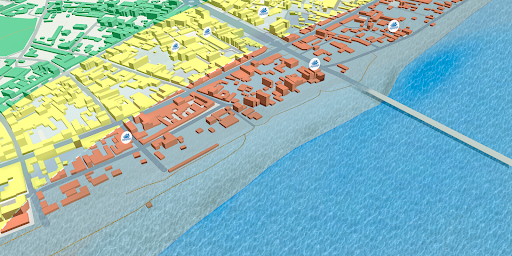

DASTAA is an integrated assessment tool that provides the necessary evidence to support anticipatory action decision making, from the design of the data collection survey to data visualization and analytics. The tool automatically analyzes datasets collected using a digital data collection approach and categorizes individual geographical objects into three categories: red, green, and yellow, based on the level of vulnerability/risk of the individual geographical object.
About The Digital System
Mobile Application
Make your own data collection survey forms
Plan and manage activities for collecting digital data
Assign user roles and monitor the progress of data collection work
Relevant information is disseminated with a single click
Web Application
Create a set of criteria for ranking geographical objects
Storage, management, and visualization of data
Analyze automatic data for risk/vulnerability ranking
Create an individual geographical object profile
Create your own custom reports
How DASTAA Works
DASTAA is an integrated assessment tool that provides the necessary evidence to support anticipatory action decision making, from the design of the data collection survey to data visualization and analytics. The tool automatically analyzes datasets collected using a digital data collection approach and categorizes individual geographical objects into three categories: red, green, and yellow, based on the level of vulnerability/risk of the individual geographical object.
Major Features
Design question for survey using mobile application
Interactive web mapping and granular information visualization
Criteria management for its risk assessments
Automatic categorization of household based on vulnerability and risk
Early warning module based on scenarios
Awareness and knowledge based materials
How DASTAA Works
DASTAA is an integrated assessment tool that provides the necessary evidence to support anticipatory action decision making, from the design of the data collection survey to data visualization and analytics. The tool automatically analyzes datasets collected using a digital data collection approach and categorizes individual geographical objects into three categories: red, green, and yellow, based on the level of vulnerability/risk of the individual geographical object.
Steps In Plotting
STEP 1

Understanding Risk
– Data Acquisition (Using Digital technologies, Frontier
– Hazard Models and Scenarios,
– Vulnerability, Exposure and Risk Assessment
Where Have Have We Worked?
An integrated multipurpose digital system for assesment of geographical object (buildings,spatial region etc).
6
Projects
3
Districts
6
Palikas

Partners
Supported By

Implementing Partners

Research Partner

Technology Partner

FAQs
Using forecasts or early warnings, AA aims to protect people before a disaster hits.
Household level vulnerability is a measure of household vulnerability to potential hazard based on survey data with fine-grained information.
Ranging from 0 – 1, higher value represent higher vulnerability and vice-versa.
This tool allows any digital assessment of spatial features e.g. houses, schools, roads, trees, etc and helps in decision making.
The data can be updated and other scores are updated dynamically.